The Relative Strength Index (RSI) is one of the most widely used technical indicators in stock, forex, and cryptocurrency trading. Whether you’re a beginner or an experienced trader, RSI helps you gauge the momentum of price movements and identify potential buy or sell signals.
In this comprehensive guide, we will cover:
- What RSI is and how it works
- RSI trading strategies for different market conditions
- How to combine RSI with other indicators for better accuracy
- Common mistakes to avoid when using RSI
- Best timeframes for using RSI effectively
Let’s dive in!
What is the Relative Strength Index (RSI)?

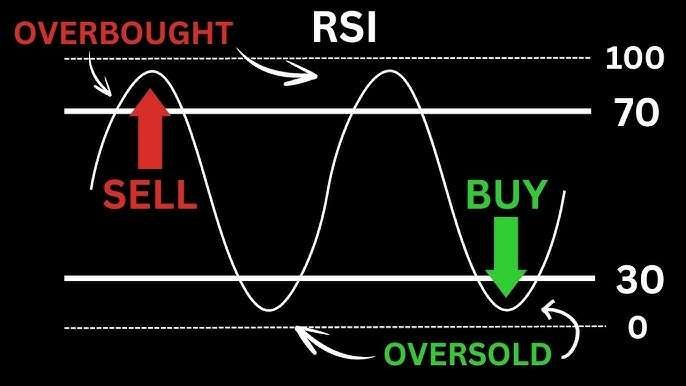
The Relative Strength Index (RSI) is a momentum oscillator that measures the speed and change of price movements. RSI helps traders determine whether an asset is overbought (potential sell signal) or oversold (potential buy signal).
RSI Formula:
Where:
- RS (Relative Strength) = Average Gain / Average Loss over a specific period (default is 14 days)
Key RSI Levels:
- Above 70 → Overbought (price may correct down)
- Below 30 → Oversold (price may bounce up)
- 50 Level → Neutral zone (trend confirmation point)
🔹 Pro Tip: RSI is most effective when combined with trendlines, moving averages, and support/resistance levels.
How to Use RSI in Trading

1. Identifying Overbought and Oversold Conditions
- BUY when RSI < 30 and crosses above 30 → Potential price reversal
- SELL when RSI > 70 and crosses below 70 → Potential price correction
📌 Example: If Tesla (TSLA) stock has an RSI of 85, it may be overbought, and a price pullback could happen soon.
2. RSI Divergence Strategy
Divergence occurs when price and RSI move in opposite directions, signaling a potential trend reversal.
Types of Divergence:
✅ Bullish Divergence (Price makes lower lows, RSI makes higher lows) → Buy Signal
✅ Bearish Divergence (Price makes higher highs, RSI makes lower highs) → Sell Signal
📌 Example: If Bitcoin is making new highs, but RSI is showing lower highs, this indicates a weakening uptrend, and a reversal might occur.
3. RSI with Moving Averages for Trend Confirmation
Combining RSI with moving averages (SMA or EMA) helps filter false signals and align with the market trend.
✔️ BUY when RSI is above 50 & Price is above 50 EMA → Strong bullish trend ✔️ SELL when RSI is below 50 & Price is below 50 EMA → Strong bearish trend
🔹 Best For: Swing traders & trend followers.
RSI Trading Strategies
1. RSI Overbought/Oversold Reversal Strategy
- BUY when RSI < 30 and crosses above 30
- SELL when RSI > 70 and crosses below 70
✅ Best for Swing Trading
❌ Avoid using in strong trending markets.
2. RSI + MACD Trading Strategy
Combining RSI with MACD enhances accuracy by confirming trend reversals.
✔️ BUY when RSI is rising from 30 and MACD shows a bullish crossover ✔️ SELL when RSI drops from 70 and MACD shows a bearish crossover
🔹 Best For: Day traders looking for quick trades.
3. RSI Breakout Strategy
Use RSI to confirm breakouts before entering a trade.
✔️ If price breaks resistance & RSI is above 50 → Strong Uptrend → BUY
✔️ If price breaks support & RSI is below 50 → Strong Downtrend → SELL
🔹 Works well with support and resistance levels.
Common Mistakes to Avoid When Using RSI
❌ Relying on RSI Alone – Always combine with price action & volume indicators.
❌ Ignoring RSI in Trending Markets – RSI works best in range-bound markets, not during strong trends.
❌ Trading Without Confirmation – Always confirm signals with moving averages, MACD, or candlestick patterns.
Best Timeframes for Using RSI
- Day Traders: Use RSI on 5-min or 15-min charts.
- Swing Traders: Use 1-hour or daily charts.
- Long-Term Investors: Use weekly or monthly RSI.
📌 Pro Tip: For crypto & forex trading, RSI settings can be adjusted from 14 to 7 for faster signals.
Conclusion
The Relative Strength Index (RSI) is a powerful tool for identifying overbought and oversold market conditions. However, it should be used alongside other indicators to improve accuracy.
Key Takeaways:
✅ RSI < 30 = Oversold (Potential Buy)
✅ RSI > 70 = Overbought (Potential Sell)
✅ Combine RSI with MACD, Moving Averages, and Divergences for better results.
Ready to Trade Smarter? Try using RSI in your next trading session and see how it improves your decision-making!
Frequently Asked Questions (FAQs)
For day trading, RSI settings can be adjusted to 7 or 9 instead of the default 14, allowing for faster signals on short-term price movements.
Yes, long-term investors can use weekly or monthly RSI to identify overbought and oversold levels in stocks or assets for strategic entry and exit points.
RSI measures momentum and overbought/oversold conditions, while MACD identifies trend direction and strength. Using both together provides stronger trade confirmation.
No, RSI works best in range-bound markets but can give false signals in strong trends. It’s best used with trend indicators like Moving Averages or MACD.
To minimize false signals:
Combine RSI with trend indicators (e.g., EMA, MACD)
Use support and resistance levels for confirmation
Trade RSI signals on higher timeframes for accuracy
RSI divergence occurs when price and RSI move in opposite directions.
Bullish Divergence (Price lower lows, RSI higher lows) → Buy Signal
Bearish Divergence (Price higher highs, RSI lower highs) → Sell Signal
Yes, RSI is widely used in crypto trading. However, since crypto markets are highly volatile, traders often adjust RSI settings from 14 to 7 or 9 for better responsiveness.


