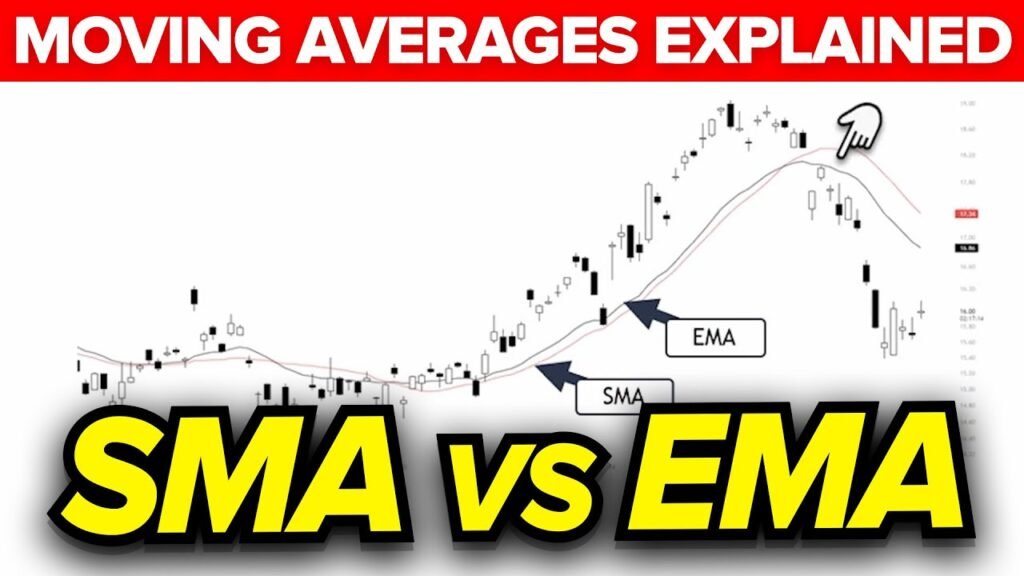
Moving Averages (MAs) are essential tools in technical analysis that help traders smooth out price fluctuations and identify trends. Two of the most commonly used moving averages are the Simple Moving Average (SMA) and the Exponential Moving Average (EMA). While both serve the same purpose analyzing trends they differ in calculation and effectiveness, especially in volatile markets.
This guide will help traders understand SMA vs. EMA, their differences, strengths, weaknesses, and when to use each for effective stock trading.
What Are Moving Averages?
A Moving Average (MA) is a widely used trend-following indicator that smooths out price data by creating a constantly updated average price over a specific period. It helps traders:
- Identify trends in the stock market.
- Determine support and resistance levels.
- Reduce the impact of short-term price fluctuations.
Moving Averages are divided into two primary types: Simple Moving Average (SMA) and Exponential Moving Average (EMA). Each has its advantages and is used in different market conditions.
What is the Simple Moving Average (SMA)?

Definition & Calculation
A Simple Moving Average (SMA) is calculated by adding up the closing prices over a specific number of periods and dividing by that number.
Formula for SMA:
Where:
- P = Price at each period
- n = Number of periods (e.g., 10-day SMA, 50-day SMA)
Key Characteristics of SMA:
✔ Provides a smooth trend line, reducing market noise. ✔ Slower to react to sudden price changes. ✔ Useful for long-term trend analysis.
Weaknesses of SMA:
❌ Lagging Indicator – Since it treats all price points equally, it may delay signals. ❌ Less effective in fast-moving markets.
What is the Exponential Moving Average (EMA)?

Definition & Calculation
An Exponential Moving Average (EMA) gives more weight to recent price data, making it more responsive to price changes.
Formula for EMA:
Where:
- Multiplier = (n = number of periods)
Key Characteristics of EMA:
✔ Faster reaction to price movements, making it ideal for short-term traders. ✔ More sensitive to recent price changes. ✔ Useful in volatile markets.
Weaknesses of EMA:
❌ More prone to false signals in choppy markets. ❌ Less reliable for long-term analysis compared to SMA.
Key Differences Between SMA and EMA
| Feature | Simple Moving Average (SMA) | Exponential Moving Average (EMA) |
|---|---|---|
| Calculation | Averages all price points equally | Gives more weight to recent prices |
| Reaction to Price Changes | Slower reaction | Faster reaction |
| Best for | Long-term trend analysis | Short-term trading |
| Performance in Volatile Markets | Less effective | More effective |
| False Signals | Fewer false signals | More false signals |
When to Use SMA vs. EMA?
When to Use SMA
✔ Best for long-term trends (e.g., 50-day or 200-day SMA).
✔ Good for identifying strong support and resistance levels.
✔ Ideal for stable markets with fewer fluctuations.
📌 Example: Investors analyzing long-term stock trends use 200-day SMA to identify market direction.
When to Use EMA
✔ Best for short-term trading (e.g., 9-day or 21-day EMA).
✔ Good for quick entry and exit signals.
✔ Ideal for fast-moving markets like forex and crypto.
📌 Example: Day traders and scalpers use 9-day EMA to detect quick price reversals.
Popular Moving Average Strategies Using SMA and EMA
1. Moving Average Crossover Strategy
This strategy uses two moving averages to generate buy and sell signals.
✔ Buy Signal: When a shorter-term moving average (e.g., 10-day EMA) crosses above a longer-term moving average (e.g., 50-day SMA) → Bullish Signal.
✔ Sell Signal: When a shorter-term MA crosses below a longer-term MA → Bearish Signal.
2. Support and Resistance Strategy
✔ Stocks tend to bounce off long-term SMAs (e.g., 200-day SMA) in uptrends.
✔ Traders use SMA levels as support in bull markets and resistance in bear markets.
3. EMA Trend Confirmation Strategy
✔ A rising 9-day EMA above 21-day EMA confirms an uptrend.
✔ A falling 9-day EMA below 21-day EMA confirms a downtrend.
Pros and Cons of SMA vs. EMA
Pros of SMA
✔ More stable and reliable in long-term trend analysis.
✔ Fewer false signals in sideways markets.
✔ Easy to use for beginners.
Cons of SMA
❌ Slower reaction to new price changes.
❌ Not ideal for short-term trading.
Pros of EMA
✔ Faster reaction to price movements.
✔ Works well for short-term trading strategies.
✔ Ideal for volatile markets.
Cons of EMA
❌ More false signals in choppy markets.
❌ Less reliable in long-term trend identification.
Conclusion: Which One is Better?
The choice between SMA vs. EMA depends on your trading style and market conditions:
✔ Use SMA if you are a long-term investor looking for stable trend identification.
✔ Use EMA if you are a short-term trader who needs quick responses to market changes.
For best results, many traders combine both SMA and EMA to maximize accuracy.
Final Thoughts
Whether you choose SMA or EMA, mastering moving averages will enhance your trading decisions. Start experimenting with different periods and strategies to find the one that best fits your trading style!
Have questions? Let me know in the comments!
Frequently Asked Questions (FAQs)
EMA is better for day trading because it reacts faster to price changes, making it ideal for short-term trades.
The 200-day SMA is commonly used by long-term investors to identify major market trends.
Yes, many traders use SMA for long-term trends and EMA for short-term signals to get a balanced analysis.
Since EMA gives more weight to recent prices, it reacts quickly to minor price changes, leading to more false signals in choppy markets.
To reduce false signals, combine EMA with trend confirmation indicators like MACD or RSI.
Swing traders often use 50-day and 200-day EMA to identify medium-term trends.
Yes, SMA and EMA are widely used in crypto trading. The 9-day EMA is commonly used for short-term trends, while the 50-day EMA is used for longer trends.


