The Moving Average Convergence Divergence (MACD) indicator is one of the most widely used tools in technical analysis. Traders and investors rely on it to identify market trends, momentum shifts, and potential buy and sell signals. Developed by Gerald Appel in the late 1970s, MACD has stood the test of time and remains a staple for analyzing financial markets.
This guide provides a detailed breakdown of the MACD Indicator, covering its components, how it works, popular trading strategies, and common mistakes traders make. Additionally, we will discuss how to combine MACD with other indicators for a more refined trading approach and share real-life trading experiences.
Understanding the MACD Indicator
The MACD Indicator consists of three primary components:
- MACD Line – This is the difference between the 12-day Exponential Moving Average (EMA) and the 26-day EMA. It represents short-term momentum in relation to long-term price movement.
- Signal Line – A 9-day EMA of the MACD Line. It smooths fluctuations and helps generate trading signals.
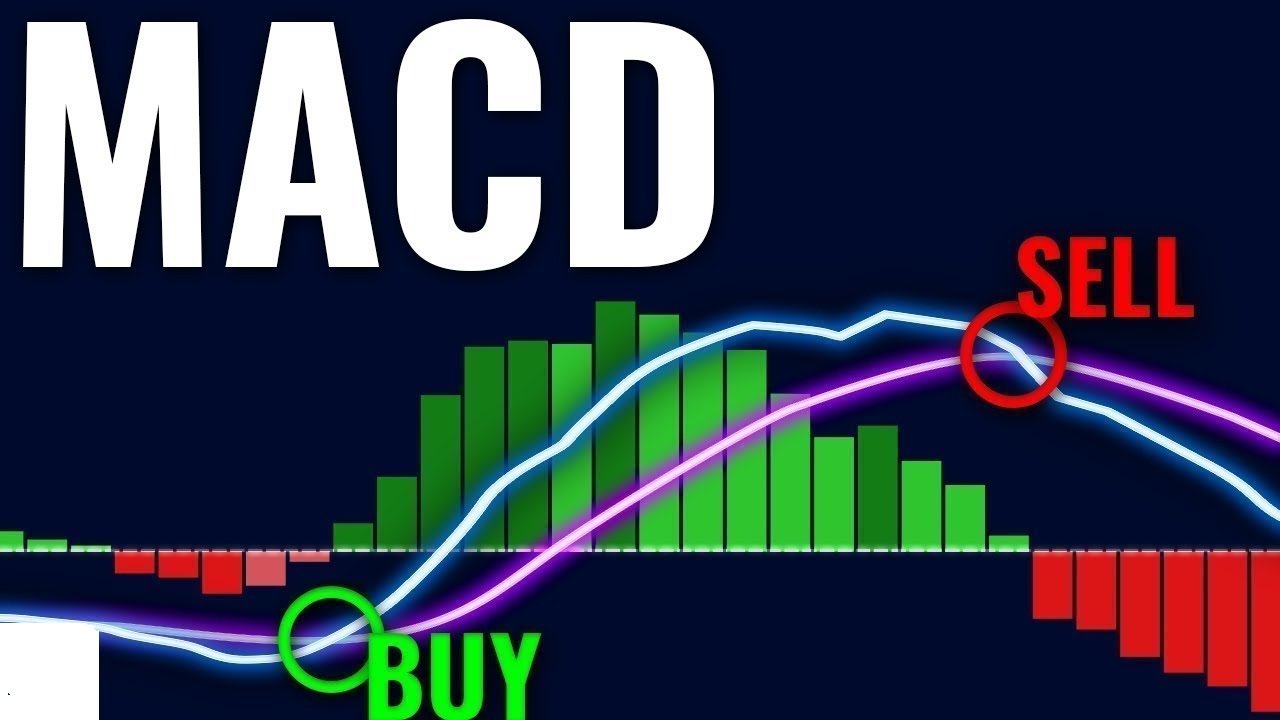
- Histogram – The difference between the MACD Line and the Signal Line. It visually represents momentum strength, with increasing histogram bars indicating stronger trends and decreasing bars signaling a weakening trend.
By analyzing these components, traders can gain valuable insights into market momentum and price trends.
How MACD Indicator Works

1. MACD Line and Signal Line Crossovers
- Bullish Crossover – When the MACD Line crosses above the Signal Line, it suggests increasing upward momentum and a potential buy signal.
- Bearish Crossover – When the MACD Line crosses below the Signal Line, it indicates downward momentum, often considered a sell signal.
2. Histogram Interpretation
- Expanding Histogram Bars – When the bars grow in height, it signals increasing momentum in the prevailing trend.
- Contracting Histogram Bars – When the bars shrink, it suggests declining momentum, potentially leading to a trend reversal.
3. Zero Line Crossovers
- MACD Crossing Above Zero – When the MACD Line moves above the zero level, it suggests a bullish trend as the short-term EMA rises above the long-term EMA.
- MACD Crossing Below Zero – When the MACD Line drops below zero, it indicates bearish sentiment as the short-term EMA falls below the long-term EMA.
MACD Trading Strategies
1. Trend-Following Strategy
The MACD indicator helps traders confirm ongoing trends. If the MACD is above zero, it reinforces a bullish trend, and if below zero, it suggests a bearish trend. Traders can enter trades in the direction of the prevailing trend for higher success rates.
2. MACD Crossover Strategy
This strategy involves entering trades based on the crossover of the MACD Line and the Signal Line:
- Buy Signal – When the MACD Line crosses above the Signal Line.
- Sell Signal – When the MACD Line crosses below the Signal Line.
Traders often wait for confirmation from other indicators before executing trades.
3. MACD Divergence Strategy
Divergence between price action and MACD can signal potential trend reversals:
- Bullish Divergence – When price forms lower lows while MACD forms higher lows, it indicates potential upward momentum.
- Bearish Divergence – When price forms higher highs while MACD forms lower highs, it signals potential bearish momentum.
Combining MACD with Other Indicators
To improve accuracy, traders often combine MACD with other indicators:
- MACD + RSI – Using the Relative Strength Index (RSI) helps identify overbought and oversold conditions alongside MACD’s trend signals.
- MACD + Moving Averages – Combining MACD with a 50-day or 200-day moving average helps confirm long-term trend directions.
- MACD + Support & Resistance – Identifying key support and resistance levels in conjunction with MACD crossovers enhances trade entry and exit decisions.
Common Mistakes When Using MACD
- Relying on MACD Alone – Traders should always confirm signals with additional indicators or price action analysis.
- Misinterpreting Weak Crossovers – Not all MACD crossovers result in significant price movements. It’s crucial to check volume and trend strength before acting.
- Ignoring Market Conditions – MACD works best in trending markets but can give false signals in sideways or choppy conditions.
Practical Tips for Trading with MACD
- Analyze Multiple Timeframes – Looking at MACD signals across different timeframes can help filter out false signals.
- Use a Demo Account – Before applying MACD strategies in live trading, practice with a demo account to refine your approach.
- Implement Stop-Loss Orders – Setting stop-loss levels helps manage risk and protect capital in case of unexpected market movements.
My Personal Experience with MACD
During my early trading days, I struggled with trend confirmation. I often entered trades too early or too late, leading to losses. When I started using the MACD Indicator, it completely changed my approach.
Example 1: Trading EUR/USD with MACD Crossovers
While analyzing EUR/USD, I noticed a bullish crossover where the MACD Line crossed above the Signal Line. The RSI also indicated an oversold condition, confirming a strong buy opportunity. I entered a long position and rode the trend until the MACD showed a bearish crossover, securing a 3:1 profit-to-risk ratio.
Example 2: Stock Market Trading with MACD Divergence
While monitoring Tesla (TSLA) stock, I noticed bearish divergence – the price formed higher highs, but MACD formed lower highs. This signaled weakening momentum, and I exited my position right before a price drop, avoiding potential losses.
Example 3: Combining MACD with Moving Averages
I used a 50-day moving average with MACD to confirm trend direction. When MACD crossed above zero and the price was above the moving average, I confidently entered a buy trade, which resulted in a strong upward movement.
These real-world experiences showcase how the MACD Indicator helps traders make informed decisions, reducing uncertainty and improving trade timing.
Conclusion
The MACD Indicator is a powerful technical tool for identifying trends, momentum shifts, and trade signals. Whether used alone or in combination with other indicators, it enhances decision-making and risk management for traders and investors alike.
To maximize success with MACD: ✅ Use crossovers and divergence signals for entry and exit points. ✅ Combine MACD with RSI, Moving Averages, or Support & Resistance for better accuracy. ✅ Always consider market conditions before executing trades.
By incorporating these strategies and avoiding common pitfalls, traders can leverage MACD effectively in their trading journey. Start using the MACD Indicator today and refine your trading approach for greater profitability!
Frequently Asked Questions (FAQs)
The MACD indicator helps traders and investors identify trends, momentum shifts, and potential buy or sell signals by analyzing the relationship between short-term and long-term moving averages.
A bullish crossover occurs when the MACD Line crosses above the Signal Line, indicating a potential buying opportunity. A bearish crossover happens when the MACD Line crosses below the Signal Line, suggesting a selling opportunity.
The MACD histogram represents the difference between the MACD Line and the Signal Line. Expanding bars indicate strengthening momentum, while contracting bars suggest momentum weakening, potentially leading to a trend reversal.
Yes, MACD is versatile and can be used for day trading, swing trading, and long-term investing. It works well in trending markets but can give false signals in choppy or sideways markets.
Traders can combine MACD with other indicators like RSI, Moving Averages, and Support & Resistance levels to confirm signals. Additionally, analyzing multiple timeframes can help filter out weak signals.
MACD measures trend strength and momentum, while RSI (Relative Strength Index) indicates overbought or oversold conditions. Combining both can provide more reliable trade signals.
Institutional traders often use MACD to confirm long-term trends and integrate it with fundamental analysis. They also apply MACD signals to high-volume stocks and forex pairs to maximize profitability.


