In the world of trading, understanding market volatility is one of the most important aspects to consider. The Bollinger Bands indicator, created by John Bollinger in the 1980s, has become a fundamental tool in technical analysis for measuring volatility and identifying potential overbought or oversold conditions. This widely-used indicator provides traders with valuable insights, helping them make informed decisions about entry, exit, and trend continuation.
Bollinger Bands measure the market’s volatility and offer dynamic support and resistance levels based on price fluctuations, making it a key indicator in identifying breakout opportunities. Let’s dive deeper into how the Bollinger Bands Indicator works and how you can use it in your trading strategy.
What Are Bollinger Bands?
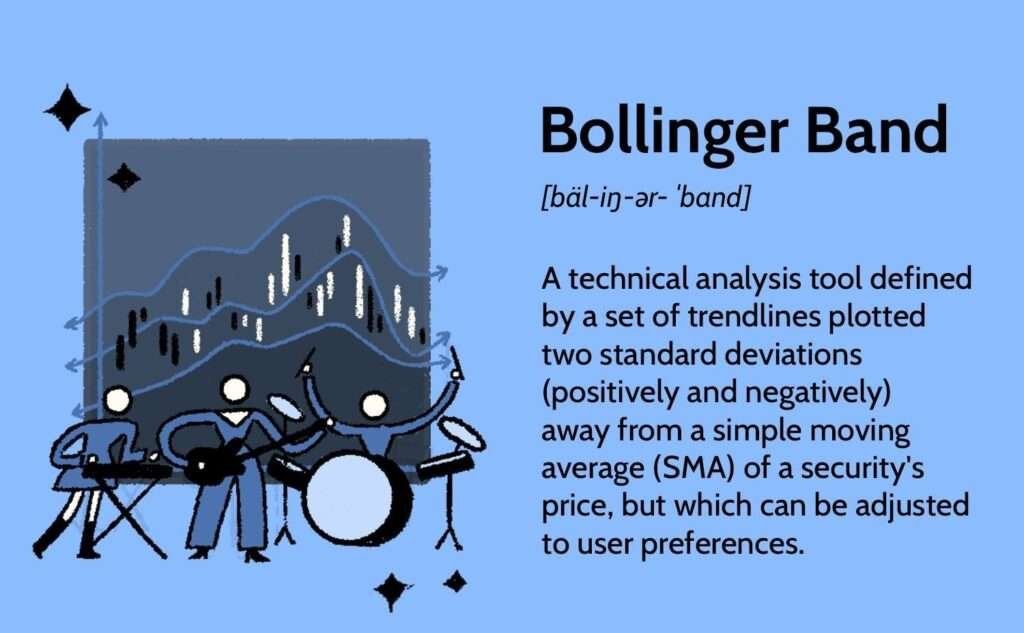
The Bollinger Bands are a volatility indicator that consists of three key components, each of which plays a unique role in helping traders understand market conditions:
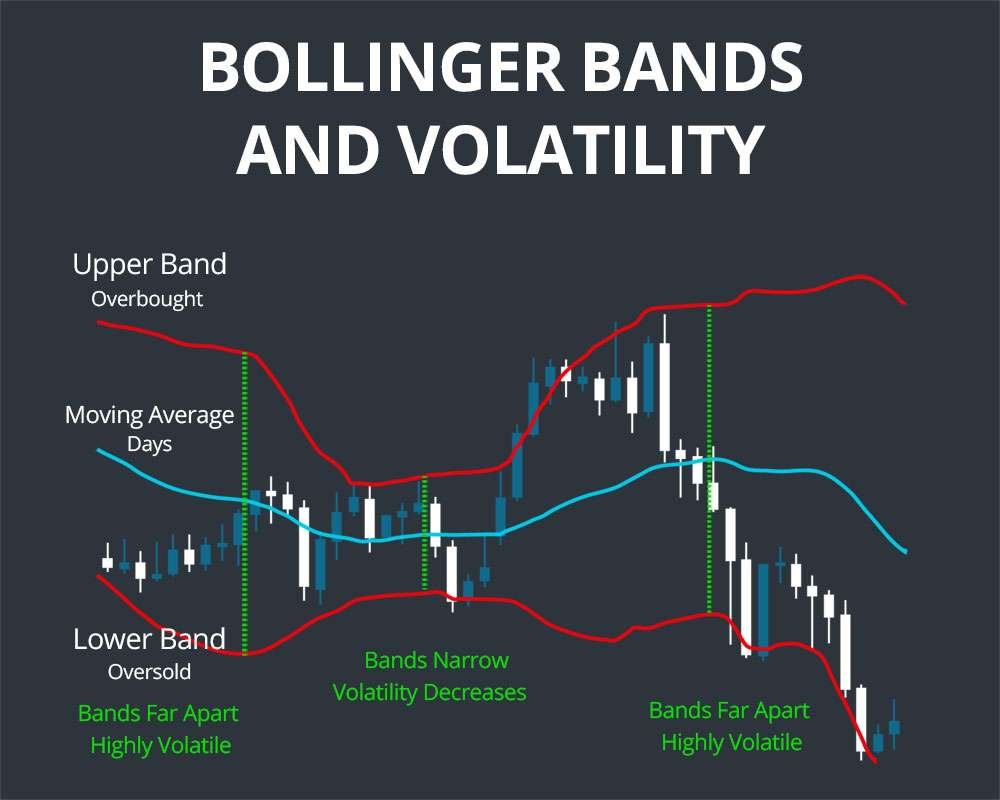
- Middle Band (SMA): This is a 20-period Simple Moving Average (SMA) of the asset’s price, representing the baseline or average price over the specified period. It helps traders understand the overall price trend.
- Upper Band: This is calculated by adding two standard deviations to the 20-period SMA. The upper band acts as an upper limit, signaling potential overbought conditions when price nears or exceeds this level.
- Lower Band: Similarly, the lower band is calculated by subtracting two standard deviations from the 20-period SMA. It acts as the lower limit and helps indicate potential oversold conditions when price moves near or below this level.
The width of the bands, particularly their expansion and contraction, is determined by the standard deviation of the price over the specified period, which is the key to measuring market volatility. When volatility increases, the bands widen, and when volatility decreases, the bands contract.
How Do Bollinger Bands Work?

Understanding Volatility
- High Volatility: When the market is experiencing high volatility, the price tends to move more dramatically. During this period, the Bollinger Bands expand, reflecting a higher level of market activity.
- Low Volatility: In quieter market conditions, where price movements are less pronounced, the Bollinger Bands contract, signaling lower volatility.
Price Movement and Band Interactions
- Upper Band Touches: When the price touches or moves beyond the upper band, it may signal that the asset is overbought, suggesting a potential reversal or price pullback. However, this does not always guarantee a trend reversal.
- Lower Band Touches: Conversely, when the price touches or moves beyond the lower band, it may signal oversold conditions, suggesting the possibility of a price reversal to the upside.
Band Squeeze and Expansion
The most critical aspect of Bollinger Bands is the squeeze and expansion of the bands, which signal changes in market conditions.
- Bollinger Band Squeeze: When the bands contract significantly, it often indicates low volatility and a potential for a breakout. A sharp price movement often follows, leading to a breakout in either direction.
- Bollinger Band Expansion: When the bands widen, it suggests an increase in volatility and that the price is in motion, either continuing the current trend or reversing.
How to Use Bollinger Bands in Trading

Bollinger Band Squeeze Strategy
- Identifying the Squeeze: The squeeze occurs when the bands narrow, indicating lower volatility. This can signal the calm before the storm, often resulting in a breakout.
- Action: Once a squeeze is identified, traders prepare for a potential breakout by confirming the direction with volume and other technical indicators. A breakout above the upper band signals a bullish trend, while a breakout below the lower band indicates a bearish trend.
Bollinger Band Breakout Strategy
- Breakout Signals: A price movement outside the bands, especially when accompanied by higher volume, is considered a strong signal of a breakout. This can indicate a continuation of the current trend.
- Action: Traders may enter positions when the price breaks outside the bands, confirming the strength of the breakout. This is particularly effective in trending markets.
Overbought/Oversold Conditions
- Upper Band (Overbought): When the price touches or exceeds the upper band, it may indicate that the asset is overbought, and a pullback could be imminent.
- Lower Band (Oversold): Similarly, when the price touches or exceeds the lower band, it may signal that the asset is oversold, and a reversal to the upside could occur.
Trading Strategies with Bollinger Bands
1. Bollinger Band Squeeze Strategy:
- Identification: Identify when the bands have contracted significantly, indicating lower volatility. A breakout is likely to occur soon.
- Action: Prepare for a breakout by waiting for the price to break outside the bands, confirming the breakout direction. Volume spikes can confirm the strength of the move.
2. Bollinger Band Bounce Strategy:
- Buy Near the Lower Band (in an Uptrend): If the price touches or bounces off the lower band during an uptrend, it suggests that the asset may be oversold and due for a reversal.
- Sell Near the Upper Band (in a Downtrend): If the price touches or bounces off the upper band during a downtrend, it suggests overbought conditions, indicating a potential price reversal.
3. Double Bottom/Top with Bollinger Bands:
- Use Bollinger Bands to spot double bottoms or double tops, which are classic reversal patterns. For example, in a double bottom pattern, when the price touches the lower band and then rebounds, it may signal a bullish reversal.
Combining Bollinger Bands with Other Indicators
To improve the accuracy of trading decisions, it is recommended to combine Bollinger Bands with other technical indicators:
- Bollinger Bands + RSI (Relative Strength Index): RSI can help confirm overbought and oversold conditions indicated by Bollinger Bands, enhancing the reliability of entry and exit points.
- Bollinger Bands + MACD: Combining Bollinger Bands with the Moving Average Convergence Divergence (MACD) can help confirm trend reversals or breakouts.
- Bollinger Bands + Moving Averages: Use moving averages to confirm the prevailing trend direction and strength, complementing the signals provided by Bollinger Bands.
Advantages and Limitations of Bollinger Bands
Advantages:
- Visualizing Volatility: Bollinger Bands are a powerful visual tool that allows traders to see volatility and price behavior in real-time.
- Ease of Use: The indicator is easy to understand and implement within any trading strategy, making it accessible for both beginners and experienced traders.
- Adaptable to Different Timeframes: Bollinger Bands work across various timeframes, from short-term intraday charts to longer-term weekly or monthly charts.
Limitations:
- False Signals in Sideways Markets: Bollinger Bands may give false signals when the market is moving sideways, as price can frequently touch or exceed the bands without indicating a true trend reversal.
- Doesn’t Predict Direction: While Bollinger Bands show market volatility, they don’t predict price direction, only helping traders gauge whether a move is likely to continue or reverse.
Practical Tips for Using Bollinger Bands Effectively
- Combine with Other Indicators: Use Bollinger Bands alongside other technical indicators, such as RSI or MACD, to increase the reliability of signals.
- Volume Analysis: Always look for a volume confirmation when a breakout occurs outside the bands.
- Multiple Timeframes: Analyze Bollinger Bands on multiple timeframes to get a clearer understanding of the market’s behavior.
My Personal Experience with Bollinger Bands
In my trading experience, Bollinger Bands have been invaluable in managing market volatility and identifying potential breakout opportunities. Let me share some personal examples.
Example 1: Bollinger Band Squeeze and Breakout
While trading the EUR/USD pair, I noticed a significant contraction in the Bollinger Bands, indicating a period of low volatility. As the squeeze developed, I prepared for a potential breakout. Shortly thereafter, the price broke above the upper band, and with volume increasing, I entered a long position. The price continued to move up, resulting in a 4% profit in just a few hours.
Example 2: Trading Stock with Bollinger Bands Bounce
I also used the Bollinger Bands Bounce Strategy on a tech stock in an uptrend. When the price dipped near the lower band, I interpreted it as an oversold condition, indicating a potential reversal. I entered a buy position and set my target near the middle band. The price reversed and reached the middle band, yielding a solid return.
Example 3: Combining Bollinger Bands and Moving Averages
I have also successfully combined Bollinger Bands with the 50-day moving average to confirm trend direction. The price staying above the moving average while the bands expanded signaled a strong bullish trend, prompting me to enter long positions with confidence.
Conclusion
The Bollinger Bands Indicator is an essential tool for assessing market volatility and identifying trading opportunities. By using the bands’ expansion and contraction, traders can anticipate breakouts and manage market risk effectively. Incorporating this tool into your trading strategy, along with other technical indicators, can enhance your ability to make well-informed decisions and boost your success in the markets.
If you’re new to Bollinger Bands, take time to practice with a demo account before applying these strategies to live trades. Over time, you’ll gain more confidence in reading market volatility and timing your trades more effectively.
FAQs about the Bollinger Bands Indicator
The Bollinger Bands Indicator is used to measure market volatility. By analyzing the distance between the upper and lower bands, traders can assess whether the market is experiencing high or low volatility. The bands also help identify potential overbought and oversold conditions, providing valuable buy or sell signals.
Bollinger Bands are composed of three lines:
Middle Band: The 20-period Simple Moving Average (SMA) of the price.
Upper Band: The SMA + 2 standard deviations of price.
Lower Band: The SMA – 2 standard deviations of price.
The bands expand during high volatility and contract during low volatility.
A Bollinger Band squeeze occurs when the upper and lower bands contract, signaling a period of low volatility. This often precedes a significant breakout in either direction, as the market is preparing for a sharp price movement. Traders watch for a breakout from the squeeze to confirm the direction of the new trend.
Upper Band: The price moving close to or above the upper band may indicate an overbought condition, suggesting a possible price pullback or reversal.
Lower Band: When the price reaches or falls below the lower band, it signals an oversold condition, often suggesting a potential upward price movement.
However, these signals are not definitive and require confirmation with other indicators or analysis.
Bollinger Bands can be effectively combined with other indicators for more reliable trading signals. Some common combinations include:
Bollinger Bands + RSI: Helps confirm overbought/oversold conditions.
Bollinger Bands + MACD: Used to confirm potential trend reversals or breakouts.
Bollinger Bands + Moving Averages: Helps validate the overall trend direction.
Bollinger Bands work best in trending markets and during periods of volatility. However, they may give false signals in sideways or range-bound markets. During low volatility, the bands contract, which might result in false breakouts. It’s essential to combine Bollinger Bands with other tools or techniques to filter out such false signals.
While Bollinger Bands are useful for identifying volatility and potential trend reversals, they do have some limitations:
False signals in sideways or choppy markets.
Lack of direction prediction, as they only measure volatility and do not indicate price direction.
Overreliance on band touch may lead to missed trades, as price may stay near the bands for extended periods.